Figure, Axes, Axis, and Subplot

As we can see, the Figure is a top-level container that includes “Axes” and “Axis”.“Axes” is the area where plots appear, while “Axis” is the axis of the plots.

Axes is set up by calling subplot, so “Axes” and “Subplot” are synonymous in many cases.
Subplot vs. Axes
Subplot can arrange grid. plt.subplot(row, col, index) return me an area where occupies part of the Figure.
For example:
plt.subplot(2, 1, 1)
plt.subplot(2, 1, 2)
Thes will give me two subplots:
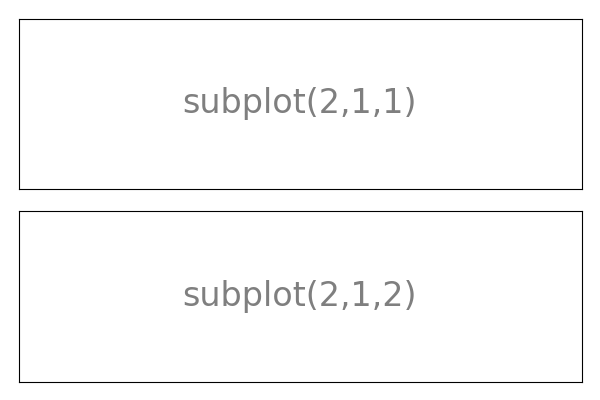
I can think that they are both in a 2x1 matrix, one is at index 1, another is at index 2, or subplot() divides the figure into seperate parts. I can add plots in 2 subplots.
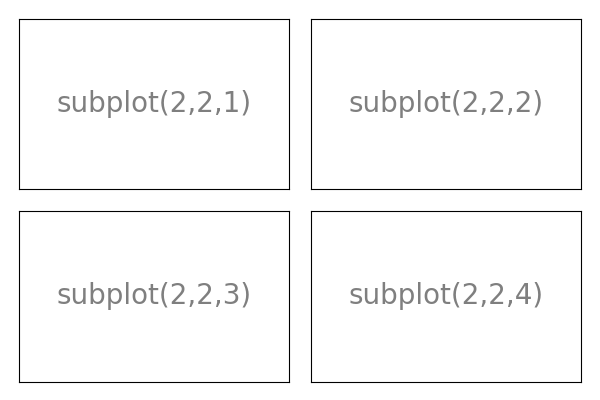
Similarly:
fig.add_subplot(2, 2, 1)
fig.subplot(2, 2, 2)
fig.subplot(2, 2, 3)
fig.subplot(2, 2, 4)
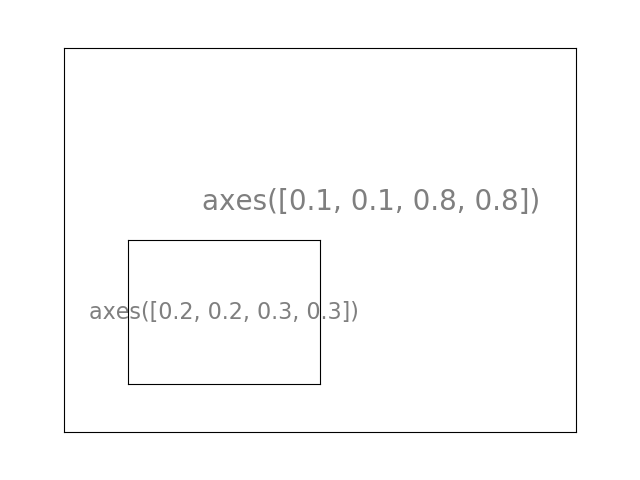
Axes is more flexible.
fig.add_axes(0.1, 0.1, 0.8, 0.8)
fig.add_axes(0.2, 0.2, 0.3, 0.3)
This will gives me: